Establish Data Connection
We will create an example demonstrating how to establish a data connection. The application example will be carried out using a PostgreSQL database running on localhost. First, we created a report named film_list. In this report, we will perform a film listing.
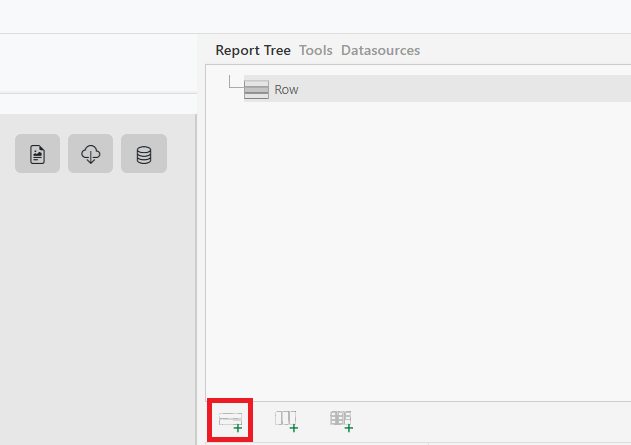
First, let’s add a report row.
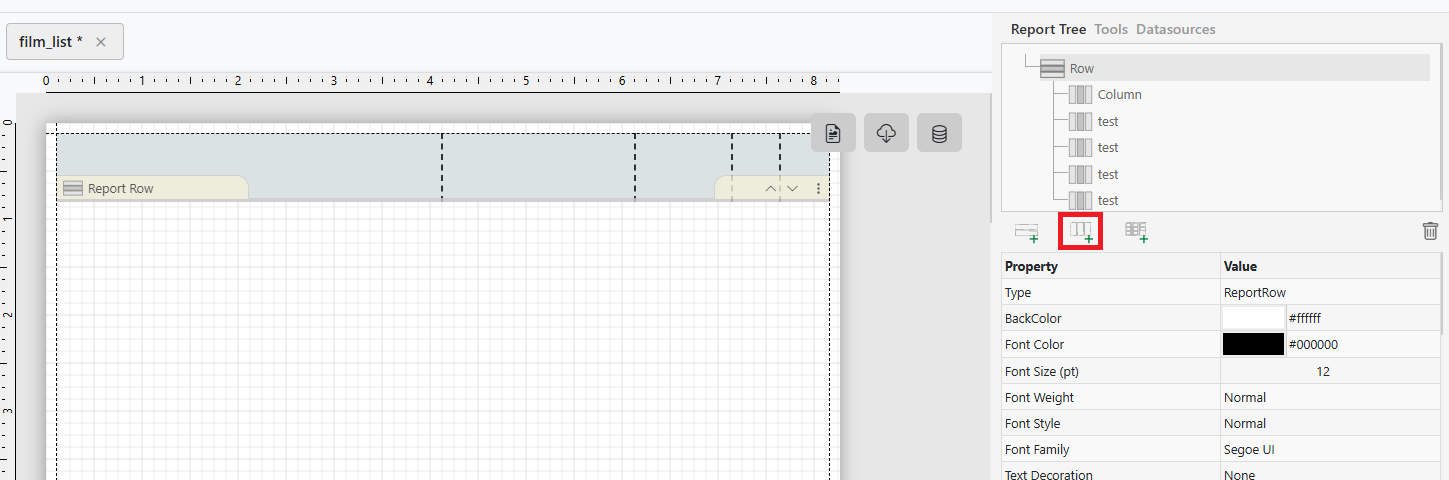
Select the report row, then add five report columns to it.”
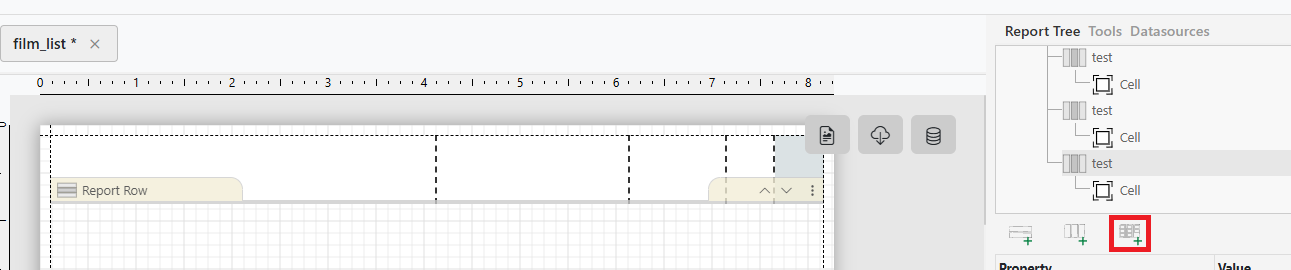
Then, select each report column one by one and add a report cell to each.
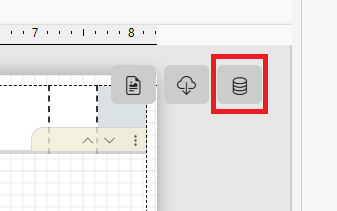
Now it’s time to set up the data connection. First, in the report design section, you will see a group of three buttons side by side in the top-right corner. From left to right, these buttons represent the following modes:
- Report Design Mode
- API Configuration Mode
- Database Configuration Mode
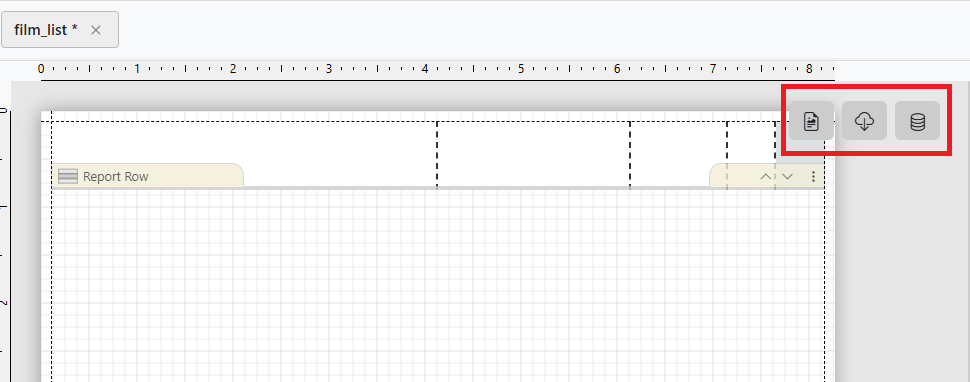
We are already in Report Design Mode. Since we will connect to a PostgreSQL database, we select Database Configuration Mode.
The following screen will appear. From here, click the Add Database button and enter the connection details for the database hosted on localhost correctly.
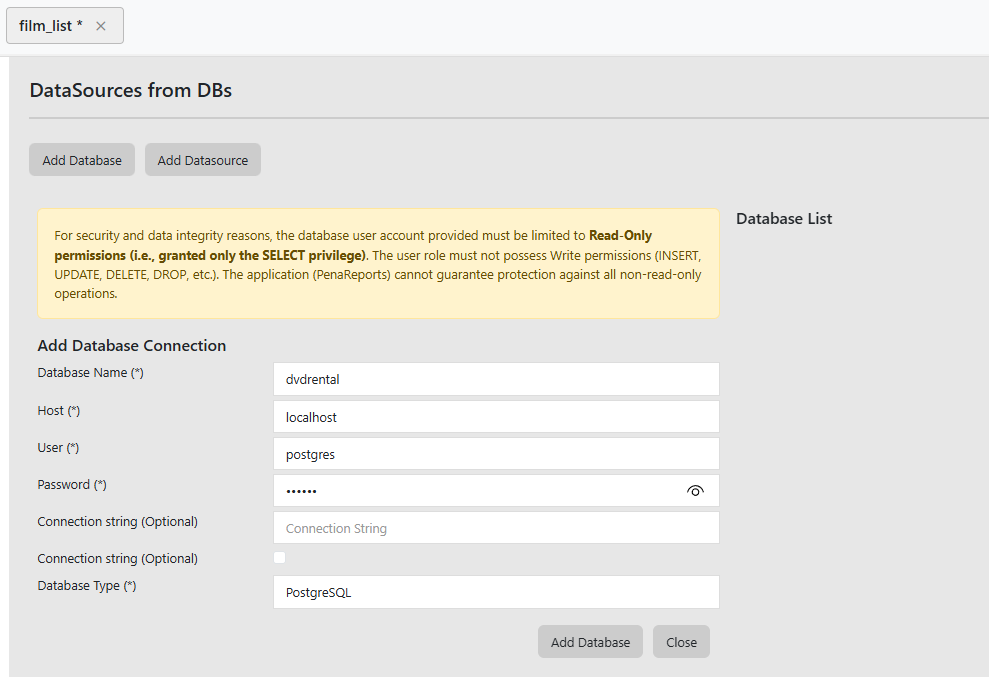
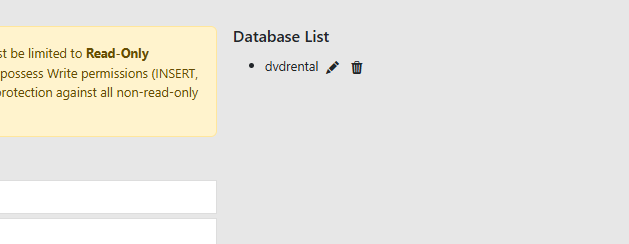
After entering the database details, click the Add Database button. If the process is successful, the dvdrental database will appear in the Database List section on the right.
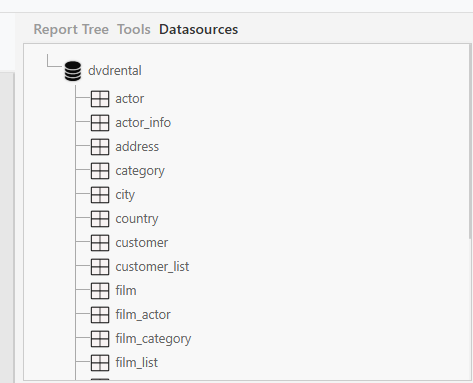
Additionally, in the side panel under the Datasources tab, you can view the dvdrental database and the tables it contains.
We have successfully set up the data connection. Now it’s time to create a datasource based on this data connection.
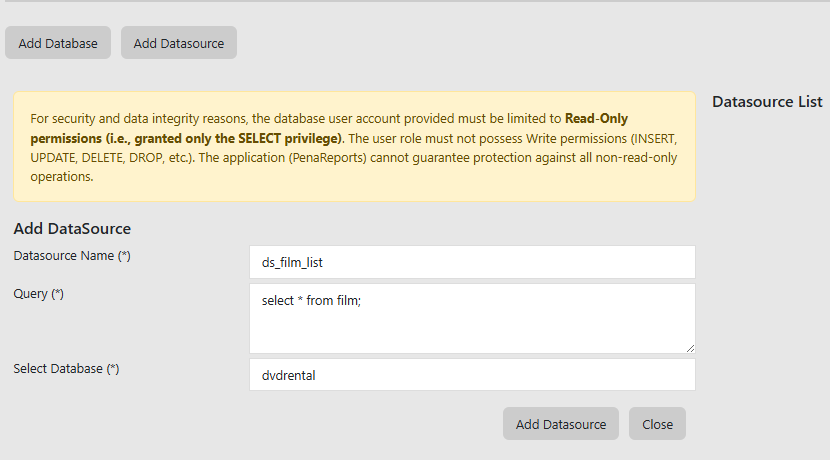
Click the Add Datasource button and fill in the required fields in the datasource creation form. Since we will list films, we need data from the film table. For this reason, we enter the required SQL query, select the dvdrental database that the datasource will be connected to, and then click Add Datasource to create the datasource.
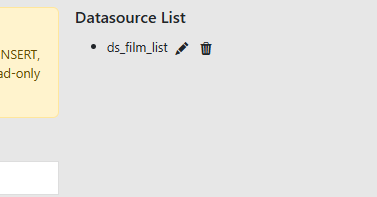
After the addition is completed, you can see the datasource you added in the Datasource List.
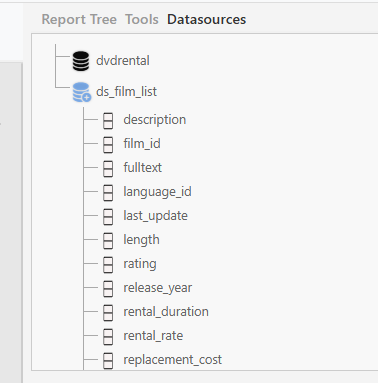
From the Datasources tab in the side panel, you can also view in detail which fields the datasource you added contains.
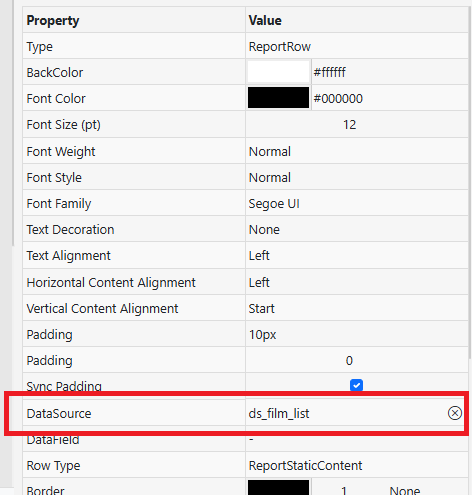
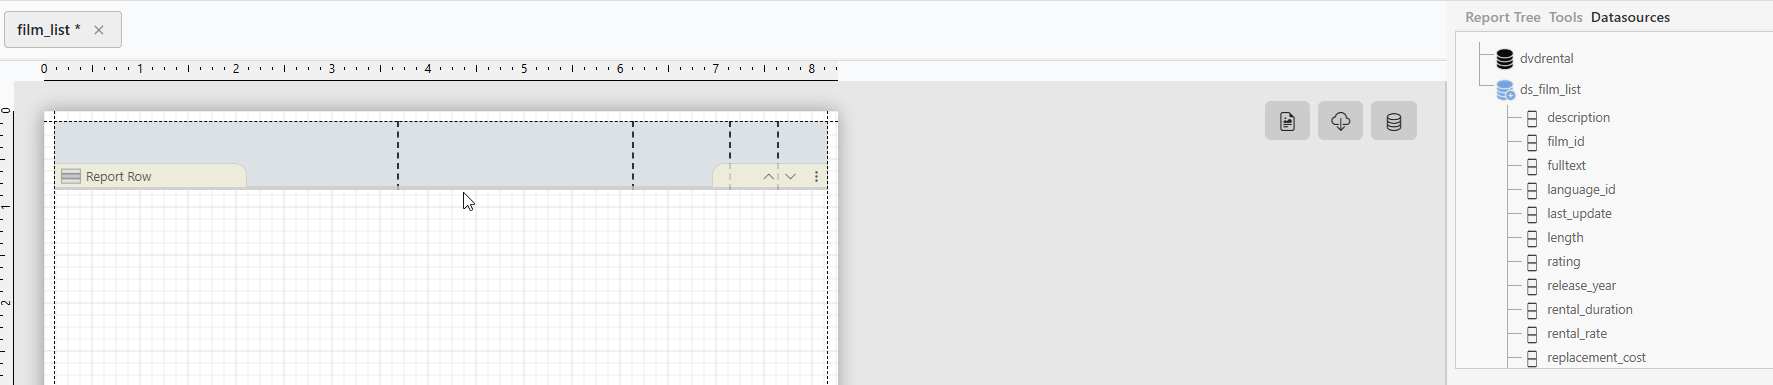
We can now use the datasource we created. First, switch back to Design Mode, then drag and drop this datasource from the Datasources tab onto the Report Row element.
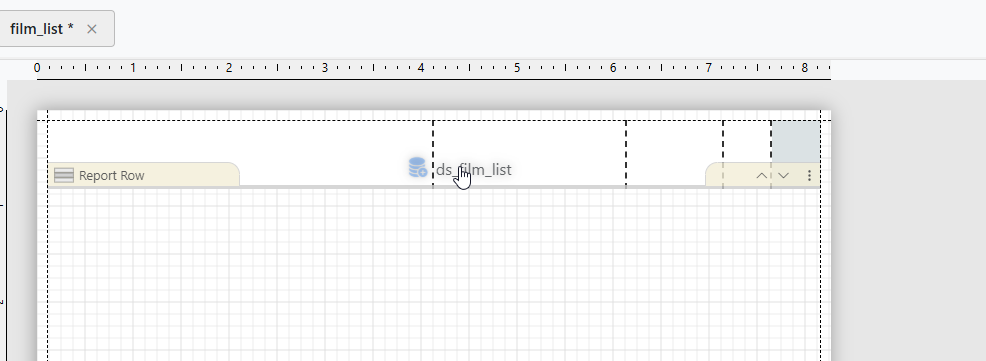
To verify that the datasource has been successfully bound, select the Report Row element and check the DataSource property in the property panel. You will see that it has been bound.
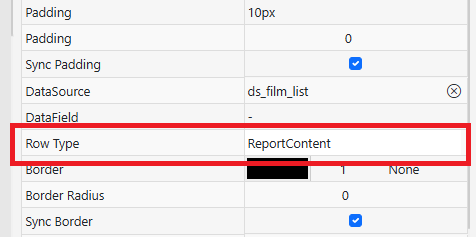
Additionally, set the Row Type value of the Report Row element to ReportContent.
Now, place the fields you want to display onto the report cell elements one by one using drag and drop.
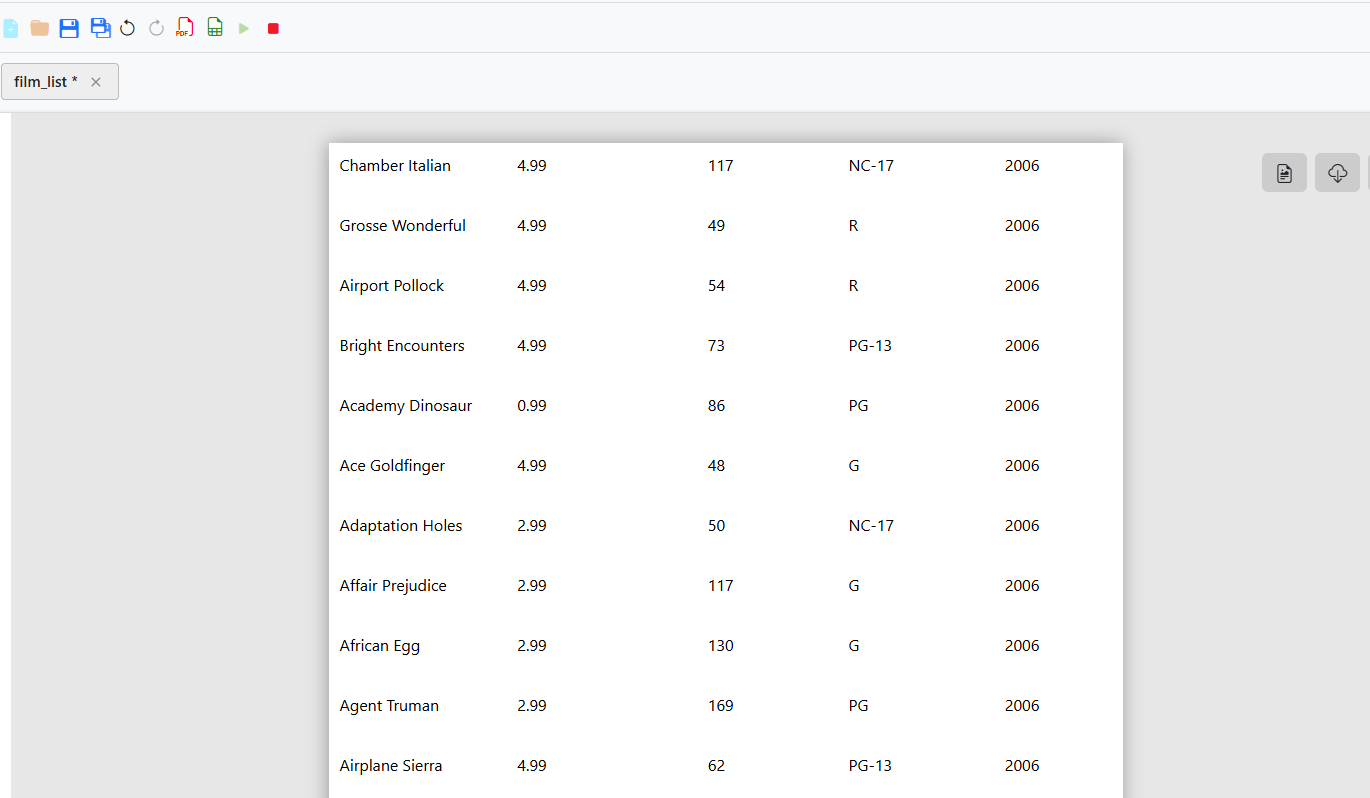
When we preview the report, we see that the data is listed successfully. Additionally, we can export this file as a PDF. All we need to do is go to File > Export as PDF.
Note: It is not possible to export this report as a spreadsheet (.xlsx). Due to the nature of the spreadsheet format, only report row and table elements must be used. A separate guide on this topic will be available in the documentation.